PsCanvas / BI configuration platform

You have the data.
Give it a clear view.

Build business interfaces with charts, canvases and data bindings. Place equipment status, energy readings and spatial context where people need them.

PsCanvas◧ ◇ ⊞
Energy reading42.5 kWh
Runningrun_state
energy_kwh→chart.energy
Interactive demo / CHOOSE · BIND · PREVIEW

01 / Core capabilities

From components to a canvas. Data to a view.

01

Arrange the canvas

Choose charts and 2D / 2.5D components, then arrange them around business needs.

02

Connect the data

Bind object-model fields to components so every value has a place in the interface.

03

Design the viewing path

Connect overview and detail through POIs, pages and drill-down navigation.

02 / Interactive demo

Choose a component. Bring data into view.

Choose / Bind / Preview

COMPONENT BINDING

Choose what to display.

Use a value card for energy readings or a status point for equipment operation.

Connect a component to its field.

Map a component target to an object identifier and field, keeping layout and data separate.

See the value and its source.

Switch the data object to compare presentations. Expand the details to inspect its source.

Choose a data object

Energy meter / Equipment status
01 Choose→02 Bind→03 Preview
▥◔◇⊞
ComponentValue cardchart.energy
energy_kwh→chart.energy
Source object
SAMPLE_METER_01
Business field
energy_kwh
Collected value
42.5
Unit
kWh
Destination
chart.energy
View preview
Energy reading42.5 kWhchart.energy
Inspect data source +
Source object
SAMPLE_METER_01
Business field
energy_kwh
Collected value
42.5
Unit
kWh
Destination
chart.energy
▥◔◇⊞
ComponentStatus pointpoi.status
run_state→poi.status
Source object
SAMPLE_HVAC_01
Business field
run_state
Collected value
RUNNING
Unit
—
Destination
poi.status
View preview
Operating statusRunningpoi.status
Inspect data source +
Source object
SAMPLE_HVAC_01
Business field
run_state
Collected value
RUNNING
Unit
—
Destination
poi.status
Inspect fields and destinations +
Source object
SAMPLE_METER_01
Business field
energy_kwh
Collected value
42.5
Unit
kWh
Destination
chart.energy
Source object
SAMPLE_HVAC_01
Business field
run_state
Collected value
RUNNING
Unit
—
Destination
poi.status

CANVAS WORKSPACE

PsCanvas visual editor

Choose components on the left, arrange them on the canvas, then connect business data.
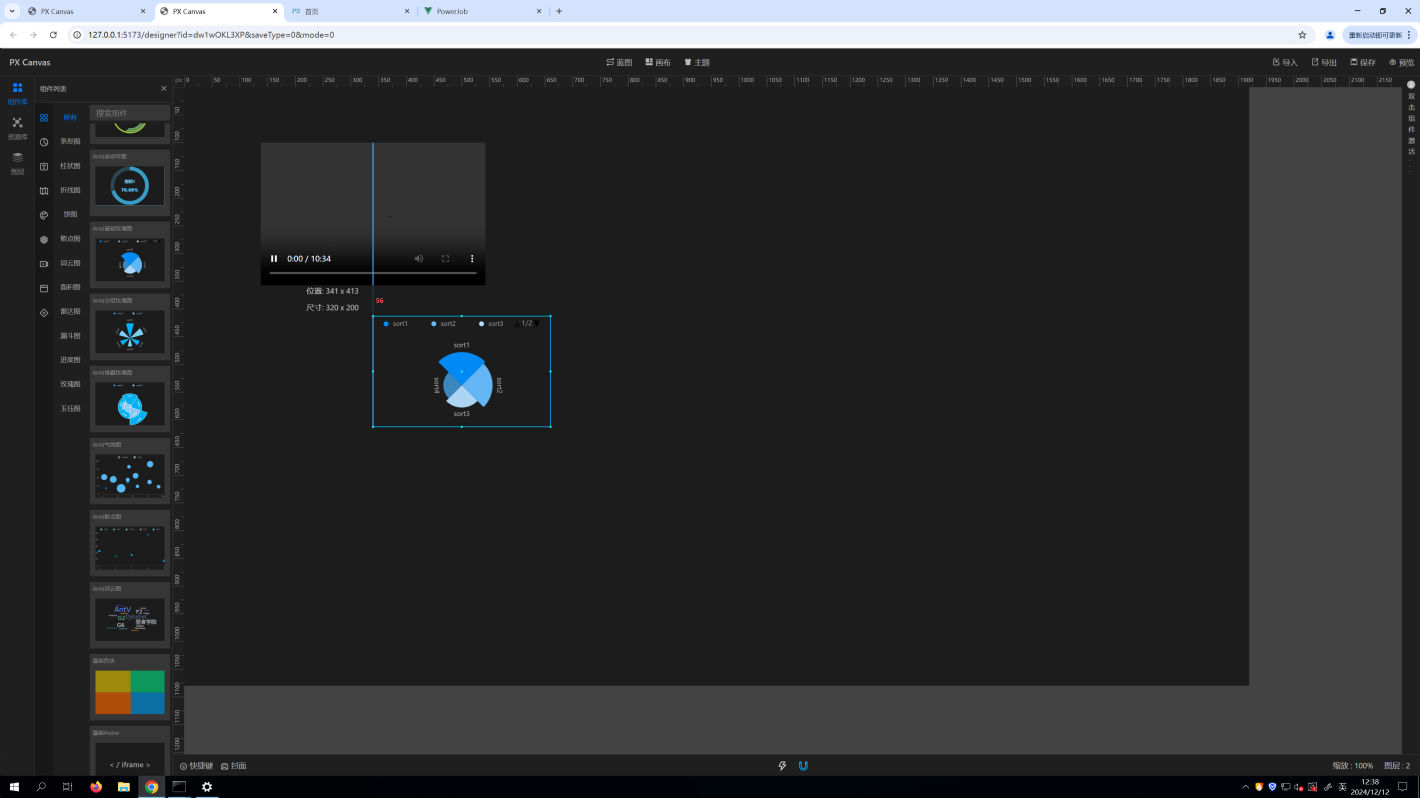
  1. Components
  2. Canvas layout
  3. Properties
Open full interface
PsCanvas visual editor123

03 / Project applications

A shared view of space and operations.

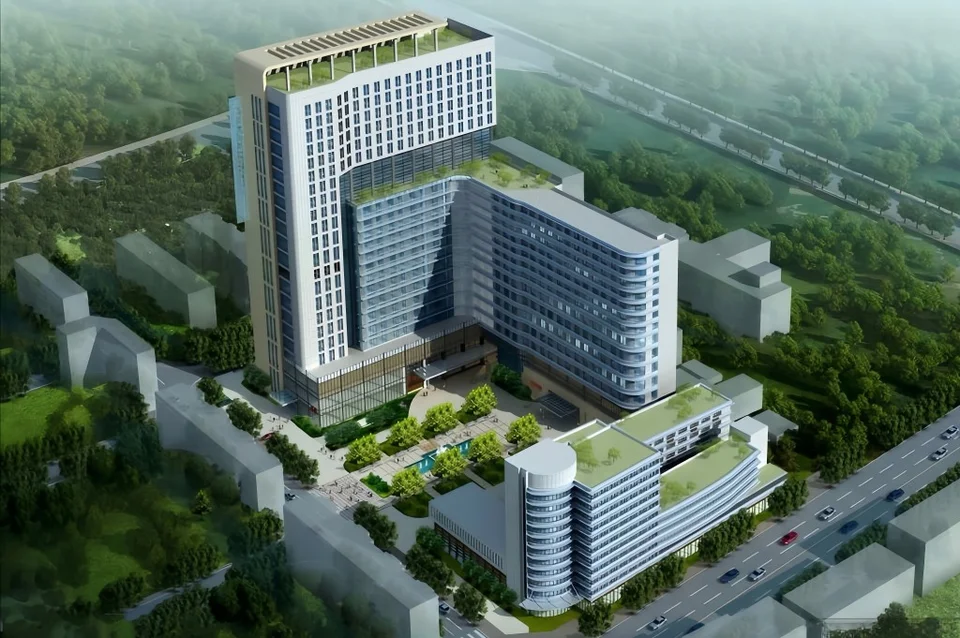
Susong Hospital visualization integration project, Anhui

HEALTHCARE

Susong Hospital visualization integration project, Anhui

A visual approach combining building spaces and cross-system information for hospital construction and operations.

Explore project

Applicable scenarios

Different roles. Different levels of detail.

Managers view the overview, engineers locate objects and site teams inspect equipment. Layout and drill-down paths organize the information each role needs.

Explore visualization

04 / YOUR NEXT PROJECT

What view do you need?
Start with a sketch.

Bring your data list, current interface or a rough sketch. We can define the components, layout and viewing paths together.

Discuss visualization

Product interface example

Product interface reference

Switch to actual size and scroll horizontally for details.