Overview
See the system
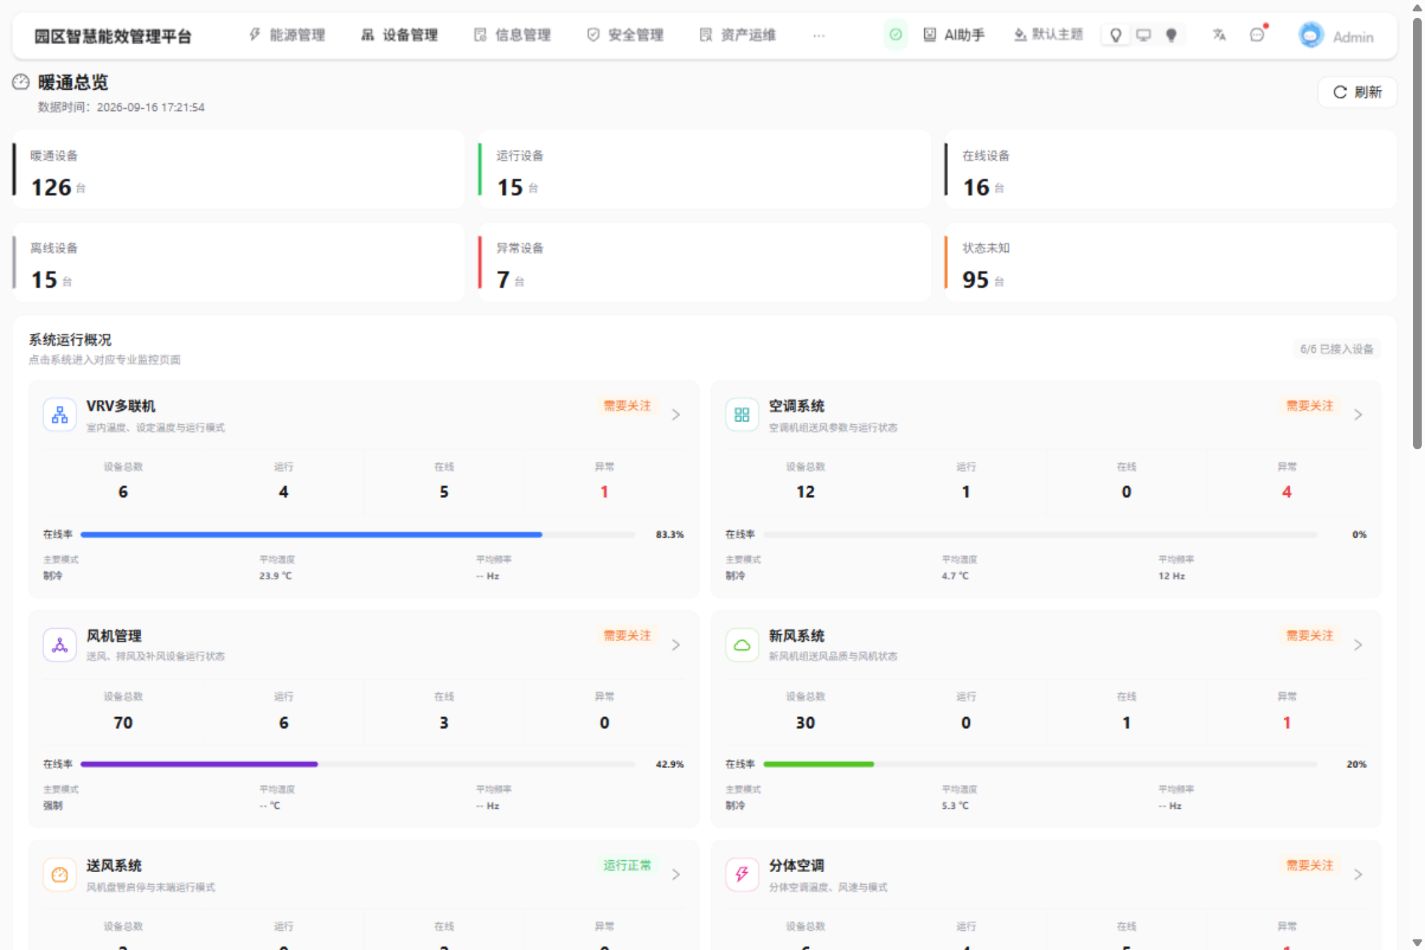
Review subsystem status and equipment that needs attention.
 PUXIAN
SMART ENERGY MANAGEMENT
PUXIAN helps operations teams locate the equipment behind an issue in 30 seconds, instead of searching across 10 separate systems.
Office supply-air unit 004
Building 1 / 1F / Office
01Equipment to review
Start from the HVAC overview and follow the equipment requiring attention.
02Located in the office area
Locate office supply-air unit 004. See its position and system diagram together.
03Next: verify site and connectivity
A heating/cooling fault is recorded, and communication is offline. Verify connectivity and site conditions before assessing its current state.
01 / FROM ISSUE TO NEXT STEP
Keep the same equipment in focus as you move through its location, diagram and records. Know what to check next.
Overview
Review subsystem status and equipment that needs attention.
Equipment
Read equipment location, system relationships and status together.
Evidence
Use fault, communication and collection records to decide what to verify next.
SMART ENERGY / START WITH METERING
Review electricity use by area and period, then bring in operating schedules and equipment records to organize the next check. Connect metering evidence with site context in one viewing path.
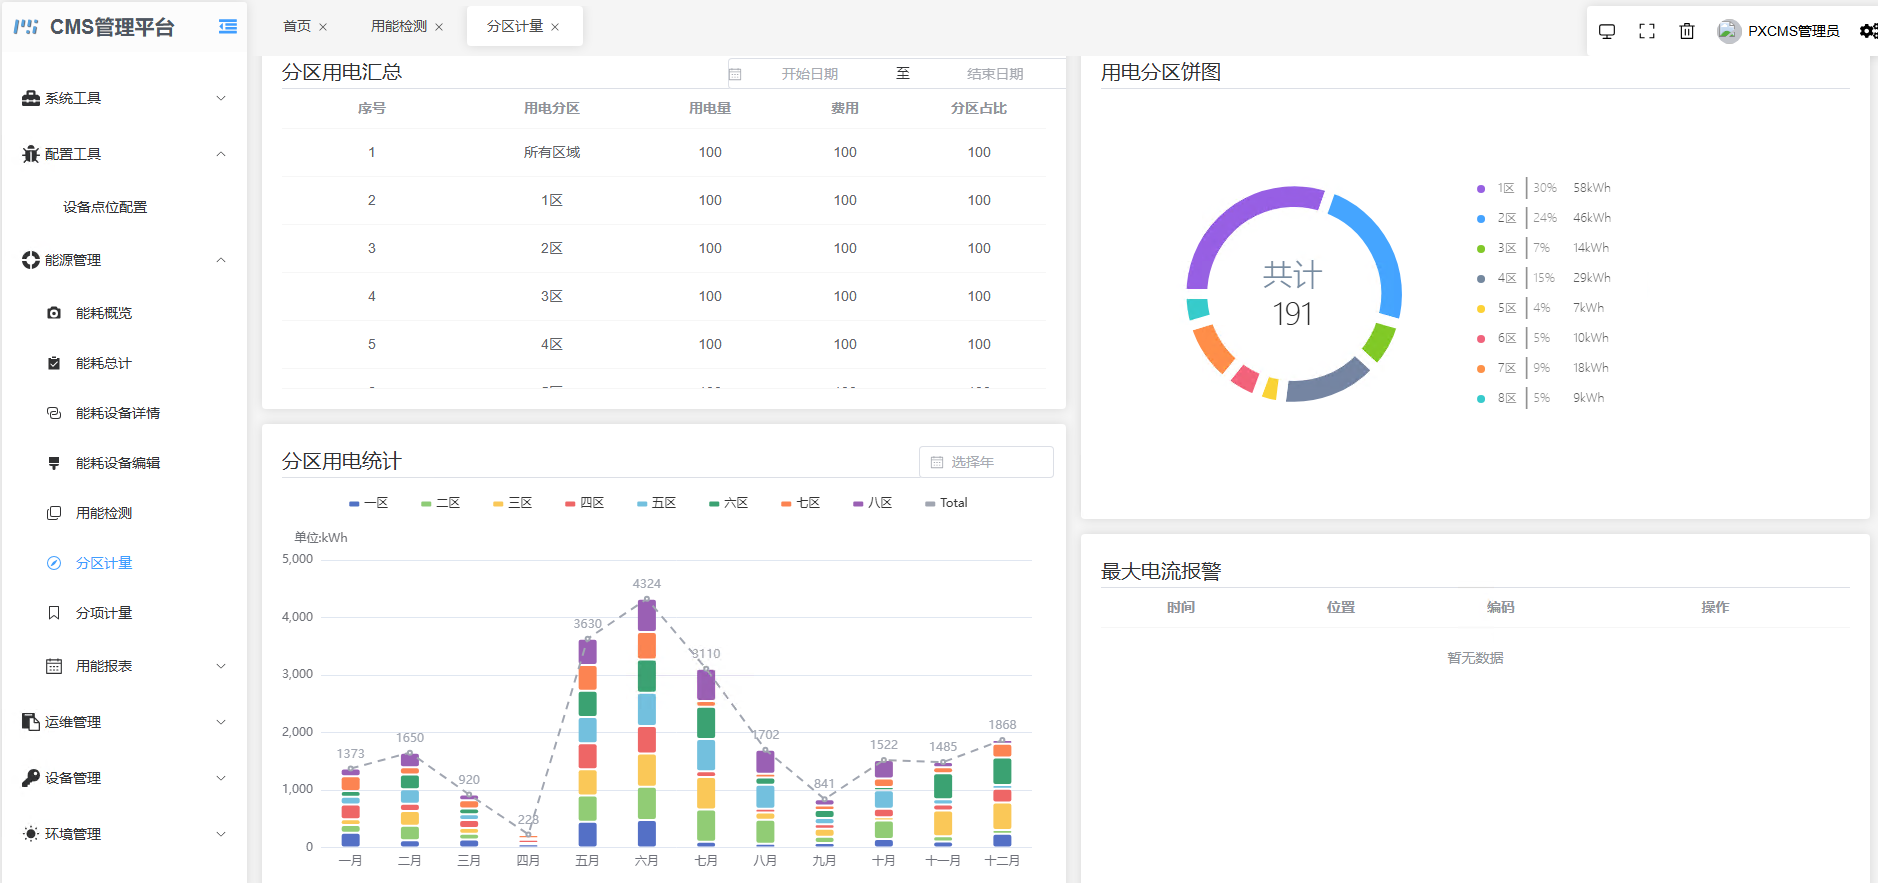 Open the full metering interface
Area totals and monthly statistics provide metering evidence; identifying causes also requires site operating records.
Read this interface by purposeSPATIAL VISUALIZATION / P.C.I
Move from campus to building to equipment. Put operating information back in its physical context.
Explore spatial integration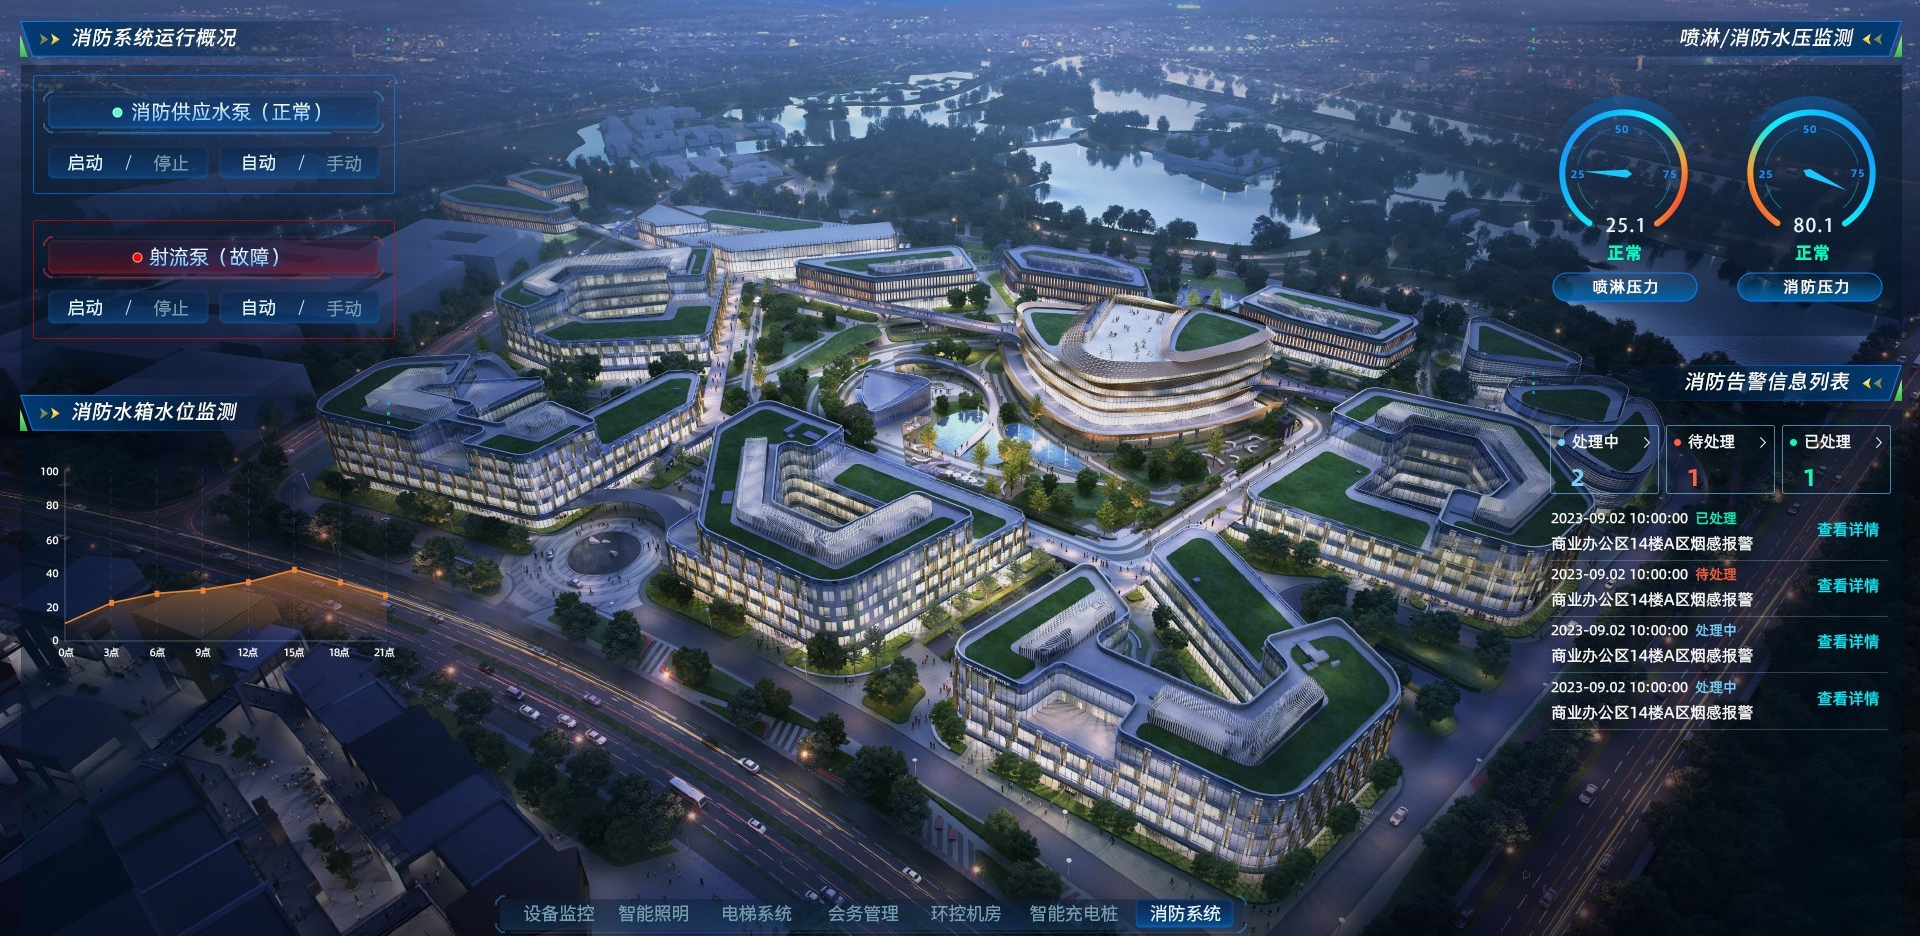 Open the full interface ↗
START WITH YOUR TASK
Start with the system list and available interfaces, then define a shared operational view.
Review metering scope, operating periods and site records together.
Start with users, fields and spatial material to discuss interfaces and location views.
Define the workflow, people and existing systems before discussing development scope.
IN PRACTICE / SUSONG HOSPITAL, ANHUI
See how buildings, floors and equipment connect in a project walkthrough.
MAKE THE NEXT STEP CLEAR
Tell us about your buildings, existing systems and goals. Together, we can map out an integration and delivery path.
Let’s discuss your needs